Robin H. Kay
Liesel Knaack
Dr. Robin Kay is with the Faculty of Education at the University of Ontario Institute of Technology. Correspondence regarding this article can be sent to: robin.kay@uoit.ca
Dr. Liesel Knaack is with the University of Ontario Institute of Technology and can be reached at: liesel.knaack@uoit.ca
The purpose of this study was to examine individual differences in attitudes toward Audience Response Systems (ARSs) in secondary school classrooms. Specifically, the impact of gender, grade, subject area, computer comfort level, participation level, and type of use were examined in 659 students. Males had significantly more positive attitudes toward ARSs than female students. Students who were more comfortable with computers had significantly more positive attitudes than students who were less comfortable. Students who did not actively participate in class before ARSs were used were more positive about this tool than students who regularly participated. Finally, students were significantly more positive about ARSs when they were used for formative (not for grades) as opposed to summative (for grades) assessment. There were no significant differences observed for grade level or subject area taught.
La présente étude visait à étudier les variations personnelles dans la disposition des élèves du secondaire envers l’utilisation de systèmes de réponse, ou télévoteurs, en classe. Plus précisément, l’étude a examiné l’impact du sexe, de l’année d’études, de la matière, de l’aisance en informatique, du niveau de participation et du type d’utilisation sur 659 élèves. La disposition des garçons envers les télévoteurs était significativement meilleure que celle des filles. De plus, les élèves les plus à l’aise avec les ordinateurs avaient une réponse significativement plus positive que les élèves moins à l’aise. Les élèves qui ne participaient pas activement en classe avant l’utilisation de télévoteurs avaient quant à eux une attitude plus positive envers cet outil que les élèves qui participaient déjà régulièrement. Enfin, les élèves démontraient une attitude plus favorable envers les télévoteurs lorsque ceux-ci étaient utilisés aux fins d’évaluations formatives (non notées), par opposition aux fins d’évaluations sommatives (notées). Il n’y avait pas de différences significatives observées en fonction de l’année d’études ou de la matière enseignée.
Audience Response System (ARSs), also known as clickers (Bergtrom, 2006) permit students to answer digitally-displayed multiple choice questions using a remote control. After students select their individual responses, the results are instantly presented in a bar chart that displays the number of students who selected each choice. The principal advantage of using an ARS is that it gives instant feedback to both students and instructors on how well the entire class understands concepts being presented using multiple choice questions. Once this feedback is attained, a teacher can alter the course of instruction or students can work out misconceptions via peer or classroom discussion and further study.
Researchers have concentrated on benefits, challenges, and strategies associated with ARS use (Caldwell, 2007; Fies & Marshall, 2006; Simpson & Oliver, 2007). Specific benefits have included increased attention during class (e.g., Siau, Sheng, & Nah, 2006; Slain, Abate, Hidges, Stamatakis, & Wolak., 2004), higher engagement in concepts presented (e.g., Bergtrom, 2006; Preszler, Dawe, Shuster, & Shuster, 2007; Simpson & Oliver, 2007), higher levels of participation (e.g., Draper & Brown, 2004; Greer & Heaney, 2004), increased attendance (e.g., Burnstein & Lederman, 2001; Greer & Heaney, 2004), improved quality of class discussion (e.g., Beatty, 2004; Brewer, 2004), and significantly higher learning performance on tests compared to traditional classes (e.g., Carnaghan & Webb, 2006; El-Rady, 2006; Latessa & Mouw, 2005). Challenges reported when an ARS is used have included technological “glitches” in the remote devices used to click in answers (e.g., Sharma, Khachan, Chan, & O'Byrne 2005; Siau, et al., 2006) and resistance to a new method of learning (e.g., Beatty, 2004). Finally, effective strategies used with ARSs have incorporated contingent teaching (e.g., Hinde & Hunt, 2006), formative assessment (e.g., Bergtrom, 2006; Dufresne & Gerace, 2004), and peer instruction (e.g., Beatty, 2004; Draper & Brown, 2004; Nicol & Boyle, 2003).
One area, though, that has been largely overlooked is individual differences in attitudes toward the use of ARSs. Anecdotal evidence suggests that not all students respond in the same way when an ARS is used in the classroom. While attitudes toward this tool have been consistently positive, some students react negatively when ARSs are used for summative assessment (e.g., Caldwell. 2007), the technology does not work well (e.g., El-Rady, 2006; Hatch, Jensen, & Moore, 2005), they have to adjust to a new style of teaching (e.g., Abrahamson, 2006), increased class discussion creates confusion (e.g., Nicol & Boyle, 2003, Reay, Bao, Li, Warnakulasooriya, & Baugh, 2005), and they have to put in the extra effort required to answer questions (e.g., Trees & Jackson, 2007).
A systematic investigation of individual differences is important for at least three reasons. First, potential inequities can be identified. For example, males may like using ARSs more than females, a result that has not been tested, but one that has been observed with other technology-based educational tools (AAUW, 2000; Barker & Aspray, 2006; Kay, 2008; Whitley, 1997). If using ARSs in the classroom partially alienates female students, we need to re-consider how to use this tool or whether it is a viable option in the classroom.
Second, understanding individual differences may help educators target and refine the use of ARSs in the classroom. It is unclear, for example, whether an ARS is a tool that can be used at all grade levels. It is conceivable that younger students may be too immature to handle the initial excitement created when an ARS is used. In addition, we do not know what subject areas might be best suited to the use of ARSs. The multiple choice questions used with an ARS may not be an ideal fit in all subject areas.
Third, exploring the impact of individual differences in how an ARS is used is essential to refining and improving its use. No technology, including ARSs, inherently improves learning. The effectiveness of this technology in the classroom depends on the pedagogy employed (Caldwell, 2007; Cuban, 2001; Russell, Bebell,, O’Dwyer, & O’Connor, 2003; Simpson & Oliver, 2007). Therefore it is important to compare the impact of different strategies used with ARSs.
An extensive assessment of peer-reviewed articles on the use of ARSs in higher education (see Caldwell, 2007; Fies & Marshall, 2006; Judson & Sawada, 2002; Simpson & Oliver, 2007 for detailed reviews) coupled with an analysis of individual differences observed in computer-related behavior on other technologies has revealed at least six potential factors that could influence attitudes toward ARSs including gender, grade, subject areas, computer comfort, participation level, and type of use.
Numerous studies have investigated the role of gender in computer behaviour (see AAUW, 2000; Barker & Aspray, 2006; Kay, 2008; Whitley, 1997 for detailed reviews). Most studies have looked at computer attitude, ability, and/or use. Roughly 30 to 50% of the studies report differences in favour of males, 10-15% in favour of females, and 40 to 60% no difference. Differences reported, while statistically significant, are often small. Overall, one could say there is a consistent pattern of small differences in computer attitude, ability, and use that favours males, however considerable variability exists. To date, no research has been done investigating gender differences in attitude toward ARSs. However, since most students have found this tool easy to learn and use (e.g., Hinde & Hunt, 2006; Pelton & Pelton, 2006; Sharma et al., 2005), it is speculated that gender will not play a significant role in the use of ARSs.
Regarding the impact of grade level or age on general computer attitudes, there has been limited research. Several studies reported that older students (15-16 years old) viewed computers as tools for accomplishing tasks and getting work done (e.g., word processing, programming, use of the Internet, and email), whereas younger students (11-12 years old) saw computers as a source of enjoyment (e.g., play games and use graphics software) (e.g., Colley, 2003; Colley & Comber, 2003).
With respect to ARSs, only one study has been done examining the role of grade level. Preszler et al. (2007) noted that third and fourth year university students were more resistant to and less accepting of ARSs than first and second year students. The older students also felt that ARSs were a distraction and had not helped them learn as much as the younger students felt they did. The authors speculated that older students may be more accustomed to a lecture mode of teaching and therefore may be more resistant to change than their younger counterparts. It is unclear how grade level would affect the use of ARSs in secondary school classrooms.
Regarding research on general computer-related behaviors, no studies could be found looking at individual differences in computer behavior as a result of subject taught. ARS research is equally silent on individual differences in student attitudes as result of subject area. However, the range of subjects that have been used with ARSs in higher education is impressive and includes accounting, anatomy, biology, business, earth science, economics, environmental science, law, math, medicine, mathematics, pharmacology, philosophy, physics, physiology, and programming (Caldwell, 2007; Fies & Marshall, 2006; Simpson & Oliver, 2007). Because of the diversity of subjects where ARS has been used, it is worthwhile investigating the impact of subject area taught on student attitudes toward ARSs.
Perceived comfort level with using computers has been shown to be particularly influential on computer ability and use (e.g., Barbeite & Weiss, 2004; Durndell & Haag, 2002; Shapka & Ferrari, 2003; Solvberg, 2002). Research on computer comfort level and ARSs has not been done, however, many studies have reported that students find ARSs easy to learn and use (Hinde & Hunt, 2006; Pelton & Pelton, 2006; Sharma, et al., 2005). Therefore, even though computer comfort level has been a prominent factor in influencing computer-related behaviours in more advanced computer technologies, it is speculated that it will not play a major role in influencing attitudes towards simple, easy to use ARS equipment.
While considerable evidence suggests that higher education students participate more when ARSs are used in the classroom (Caldwell, 2007; Uhari, Renko, & Soini, 2003; Van Dijk, Van Den Berg, & Van Keulen, 2001), it is not clear how this research translates into a secondary school environment where classes are much smaller. For example, it is possible that students who habitually participate less may benefit more when using an ARS because responding is easy to do and anonymous. One of the goals of using ARSs is to increase student engagement, so it is prudent to investigate whether previous participation levels influence acceptance.
A number of researchers have argued that the pedagogical strategies selected to integrate ARSs in the classroom have a fundamental influence on acceptance and overall success (Reay et al., 2005; Simpson & Oliver, 2007; Stuart, Brown, & Draper, 2004). Caldwell (2007) noted that higher education students did not like using ARSs for participation grades or summative assessment (Caldwell. 2007), but that they reacted well to formative assessment (e.g., Bergtrom, 2006; Dufresne & Gerace, 2004). Furthermore, Tree and Jackson (2007) added that learning preferences had an impact on attitudes toward ARSs. Students were more positive about ARSs when they valued feedback, engagement and interaction. For the most part, though, limited research has been done examining and comparing specific strategies that affect attitudes toward ARSs.
The use of ARSs is a relatively new phenomenon, particularly in secondary schools. Previous research in higher education has focussed on the benefits, challenges and strategies with respect to using ARSs. Almost no research has been done examining individual differences in attitude toward ARSs. A review of the research on ARSs and computer technology in general revealed six promising factors that might account for variability in attitudes toward ARSs.
The purpose of the current study was to investigate individual differences in secondary school students’ attitudes toward ARSs by focussing on gender, grade level, subject areas, computer comfort level, participation level, and type of use.
The student sample consisted of 659 students: 327 were males and 327 females. Five students chose not to enter their gender. Students were enrolled in grades 9 (n= 71), 10 (n=233), 11 (n=149), and 12 (n= 206). ARSs were used in five different subject areas: business (n=66), computer technology (n=42), social science (n=160), science (n=213), and math (n=134). Forty-four students did not identify a subject area. This missing subject data was dispersed across multiple classrooms. Eight-seven percent (n=572) of the students reported being comfortable or very comfortable with technology. Fifty-five percent of the students (n=364) reported that in a typical, non ARSs class, they participated a little or not at all. Data from the sample population was collected from 23 different classrooms in 15 different secondary schools. Teachers from these classrooms volunteered to participate in the study, and students were given the option of filling in a survey about ARS use. All students had to obtain signed parental permission to participate.
Twenty-three teachers (16 males, 7 females), with 1 to 26 years of teaching experience (M = 15.9, SD = 7.9), volunteered to participate in the ARS study. Most teachers reported that they were comfortable or very comfortable with technology (n=22, 96%).
An educational coordinator emailed eligible secondary school teachers within an entire district and informed them of the ARSs study. All teachers were told that participation was voluntary and that they could withdraw from the study at any time. Participants received a half day of training in November on how to use the ARS software and a half day of training February on advanced use of ARSs in the classroom. They were then asked to use ARSs in their classrooms for a period of three months, although how often ARSs were used was dictated by each teacher. Each teacher shared a laptop computer, an LCD projector, and a one ARSs system with a partner. All students participated in ARS lessons, however, only those students with signed parental permission forms were permitted to fill in an anonymous, online survey about their use of the ARSs Note that when students were using ARSs, their answers were always anonymous to other students.
The survey-based evaluation of ARSs was completed in the third month of use. During this month, 94% (n=617) of secondary students reported using ARSs one to two times. Six percent (n=41) of the students used ARSs once a week. Note that each student filled out only one survey.
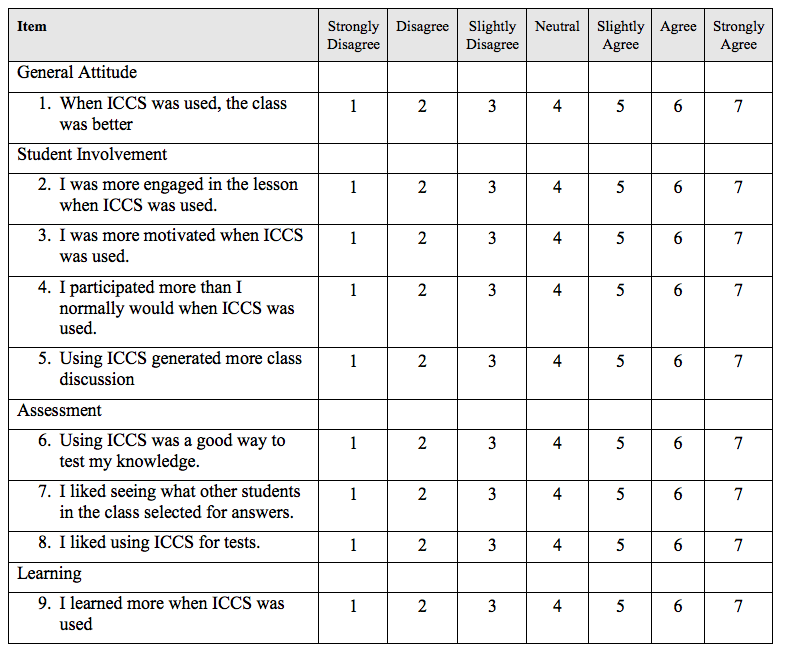
After using ARSs for three months, students completed the ARS Attitude Survey for Students (see Appendix A) targeting their last month of use. This survey consisted of nine, seven-point Likert scale items. Items were constructed based on a review of the ARS literature (Caldwell, 2007; Fies & Marshall, 2006; Simpson & Oliver, 2007) and focussed on general attitudes, student involvement, assessment, and learning. Internal consistency for the total nine-item scale was 0.89 (Cronbach’s Alpha).
Six explanatory variables were examined in this study: gender (male, female), grade level (9, 10, 11, and 12), subject area taught (business, computer technology, social science, math, and science), computer comfort level (item C in Appendix A), previous participation in non ARSs classes (low vs. high – item D in Appendix A) and type of use (formative assessment, formative and summative assessment, summative assessment). Low participation included “not at all” and “some of the time” responses from item D in Appendix A. High participation included “most of the time” and “all of the time” responses from item D in Appendix A. Type of use was determined by asking teachers whether they used ARSs for formal, graded tests (summative assessment) or to assess understanding without grades (formative assessment).
The main dependent variable used in this study was total attitude score which was calculated by adding all nine items from the ARSs scale in Appendix A. A probability level of p < .001 was used to compensate for the number of independent t-tests or ANOVAs completed (see Kirk, 1982, p. 102). If a significant difference was found within a specific explanatory variable, a formative analysis of individual items from the ARS scale was completed using a MANOVA. Scheffé’s post-hoc analysis was used to assess differences among items in the ARS scale because it is one of the most flexible, conservative, and robust procedures (Kirk, 1982). In order to assess the relative importance of the six explanatory variables in predicting total attitude toward ARSs, a stepwise, linear regression analysis was done.
To examine individual differences in student attitudes toward the use of ARSs in secondary school classrooms, the following questions were addressed:
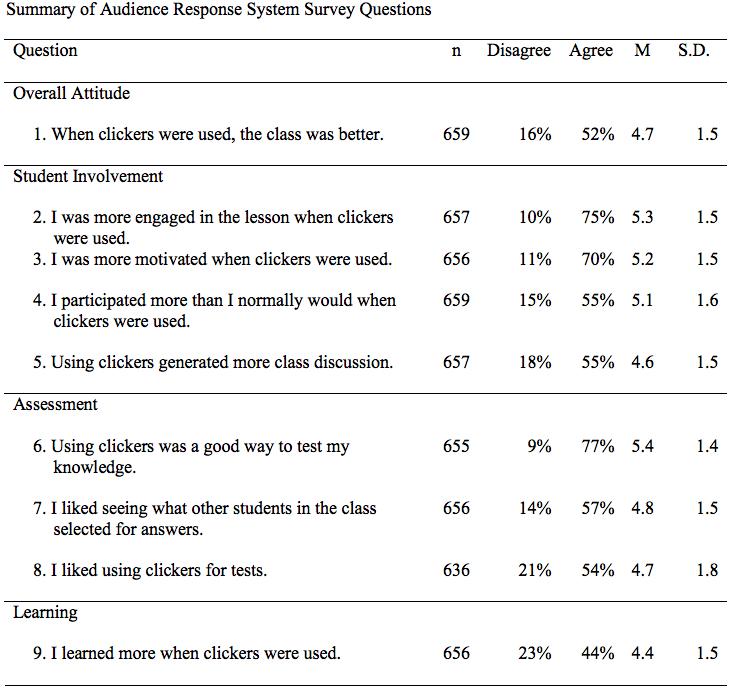
Before looking at specific sources that might contribute to explaining variability in attitudes toward ARSs, it is worth examining the overall variability of total attitude score toward ARSs. Scores ranged from a minimum of 9 to a maximum of 63 (possible range was 10 to 63) with a mean score of 44.4 (S.D. 10.1). Average item scores in the nine item scale ranged from 4.4 to 5.4 indicating that, overall, students were slightly positive about the use of ARSs (see Table 1). Because attitudes toward ARSs varied considerably, there is a need to explain observed variability.
Table 1. Summary of Audience Response System Survey Questions
With respect to total ARS attitude score, males (M= 46.1, S.D. = 9.5) had significantly more positive attitudes towards ARSs than females (M= 42.5, S.D. = 10.4) (t = 44.93, df = 615, p < 001). The effect size of 0.36 is considered to be in the medium range by Cohen (1998). Since overall attitudes toward ARSs were different, a MANOVA was run to compare male and female students on the nine Likert-scale survey items examining attitudes toward using ARSs (Appendix A). Since Hotelling’s T was significant (p <.001), individual comparisons were done on each survey question. Males and females differed significantly on all but one of the items from the ARSs attitude survey (Table 2). Specifically, males were more involved when ARSs were used, liked using ARSs to test their knowledge, especially in summative evaluation, felt ARSs helped improve their learning, and overall, thought ARS-based classes were better than traditional classes.
Table 2. 1 Gender Differences in Attitudes toward Audience Response Systems
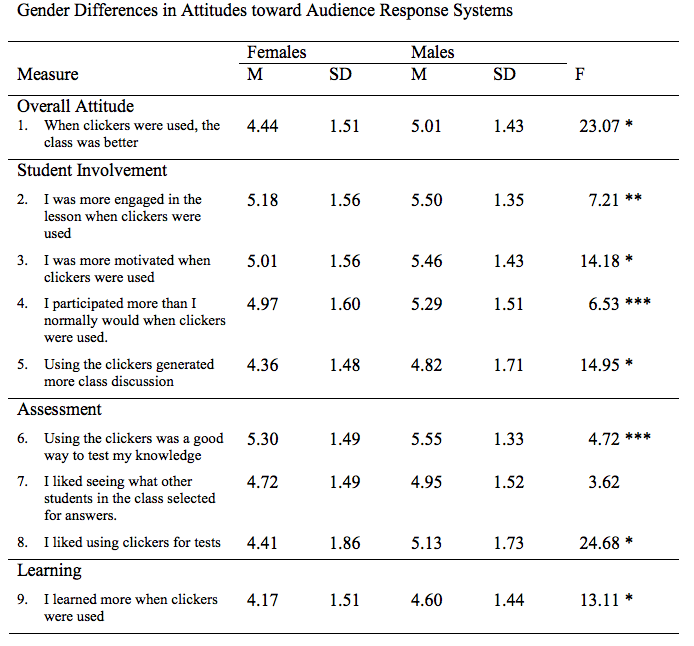
* p < .001; ** p < .005; *** p < .05
1 This table is a modified version of Table 5 from Kay, R. H. (in press). ↑
Regarding total ARS attitude score, there were no significant differences among grade 9 (M= 46.1, S.D. = 9.5), grade 10 (M= 46.0, S.D. = 8.7), grade 11 (M= 48.2, S.D. = 9.6), and grade 12 (M= 46.3, S.D. = 9.3) students, therefore individual scale items were not analyzed.
A one way ANOVA for total ARS attitude score showed significant differences among subject area (F = 10.29, p < .001). Scheffé’s post hoc analysis revealed that students using ARSs in social science (M= 47.8, S.D. = 8.6) had significantly more positive attitudes than students using ARSs in either science (M= 42.8, S.D. = 10.6) or mathematics (M= 41.2, S.D. = 10.5) with effect sizes (0.52 to 0.69 respectively) in the medium range according to Cohen (1998). In addition, students of computer technology (M= 47.6, S.D. = 6.9) had significantly more positive attitudes toward ARSs than students of mathematics (M= 41.2, S.D. = 10.5). The effect size of 0.72 was also considered to be in the medium range (Cohen, 1998).
A MANOVA was run to compare subject area taught on the nine Likert-scale survey items examining attitudes toward using ARSs (Appendix A). Hotelling’s T was significant (p < .001), so individual comparisons were done on each survey question. Social science student attitudes toward ARSs were consistently higher than mathematics and science students on most survey items (see Table 3).
Table 3. MANOVA Examining Attitude toward Audience Response Systems as a Function of Subject Area Taught
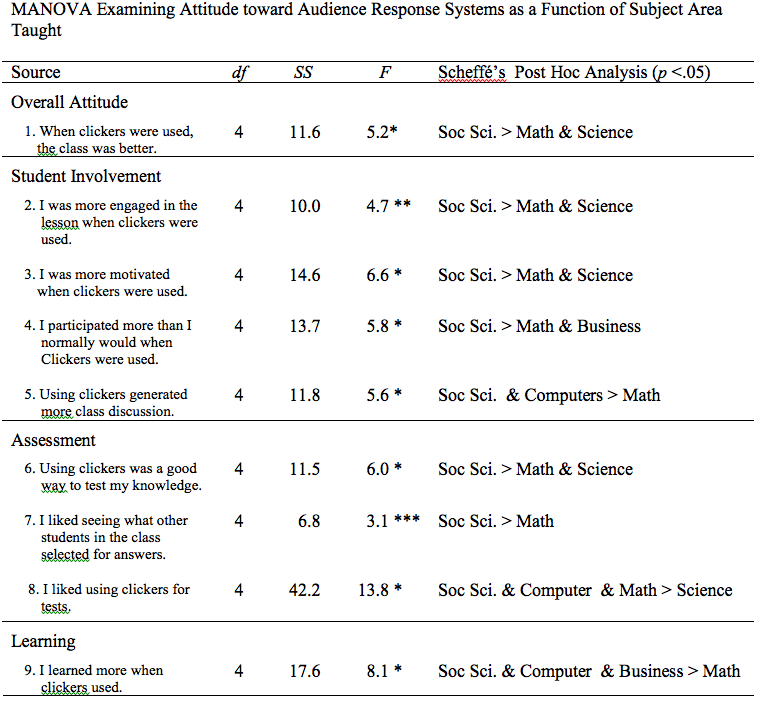
* p < .001; ** p < .005; *** p <.05
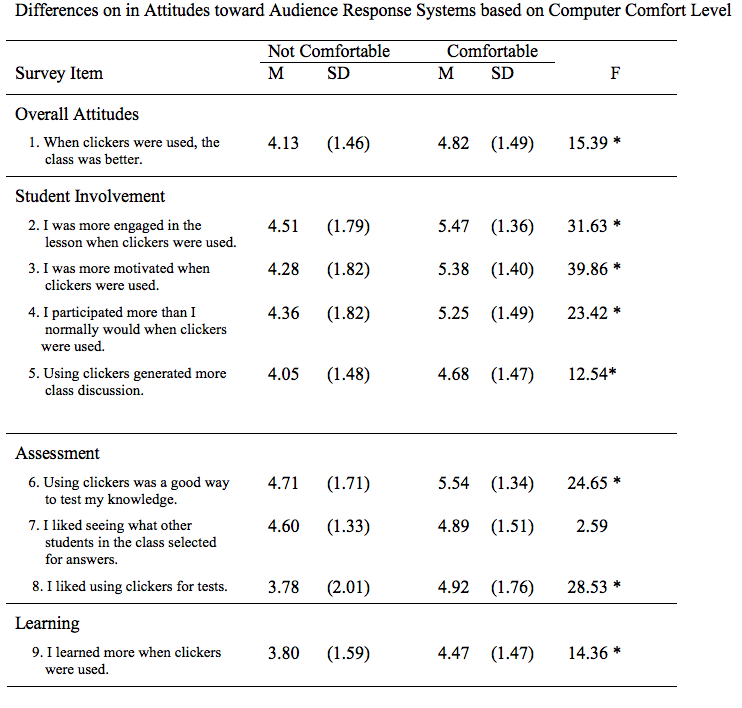
An independent samples t-test revealed that students who were comfortable with technology (M= 45.4, S.D. = 9.5) were significantly more positive about ARSs than students who were not comfortable with technology (M= 37.9, S.D. = 11.3; t=-6.46, p < .001)). The effect size of 0.72 is considered in the medium range (Cohen, 1988).
A MANOVA, used to compare students who were not comfortable with technology (n=80) with students who were comfortable with technology (n=534) on the nine Likert-scale survey items examining attitudes toward using ARSs (Appendix A), produced a Hotelling’s T that was significant (p < .001). Therefore, individual comparisons were examined for each item. Students who were more comfortable with technology were more involved when ARS was used, liked using ARSs to test their knowledge, particularly with summative evaluation, felt ARSs helped improve their learning, and overall, believed that ARS-based classes were better than traditional classes.
Table 4.2 Differences on in Attitudes toward Audience Response Systems based on Computer Comfort Level
* p < .001
2 This table is a modified version of Table 6 from Kay, R. H. (in press). ↑
In this study, students were asked their level of participation in a typical class before the study started. Three-hundred and forty-eight students reported that they never or occasionally participated in class (Low Participation), whereas 273 students said they almost always or always participated (High Participation). The independent samples t-test revealed low participation students (M= 45.1, S.D. = 10.1) were significantly more positive about ARSs than high participation students (M= 43.6, S.D. = 10.1, t=2.02, p < .05). The effect size of 0.16 is considered small according to Cohen (1988).
The participation level differences were not significant to the prescribed p < .001 level, however, because this study is a first attempt to examine individual differences, a MANOVA was run to compare low participation versus high participation students on the each of the nine, Likert-scale survey items examining attitudes toward using ARSs (Appendix A). Hotelling’s T was significant (p <. 001), so individual comparisons were examined. Low participation students felt they participated more (p < .001), liked using ARSs more for tests (p < .05), and thought they learned more when ARSs were used (p < .05). All other items showed no significant difference between low and high participation students.
A one way ANOVA for total ARS attitude score showed significant differences among type of use (F = 40.14, p < .001). Scheffé’s post hoc analysis revealed that students were significantly more positive about ARSs when formative assessment was used (M= 46.7, S.D. = 9.3), as opposed to mixed assessment (M= 42.3, S.D. = 9.4, p < .05, Cohen’s d = 0.47) or summative assessment (M= 37.7, S.D. = 10.6, p < .05, Cohen’s d = 0.90). In addition, students who experienced the mixed assessment reported significantly more positive attitudes than students who experienced summative assessment only (p < .05; Cohen’s d = 0.46). Means for all ARSs Likert item scales based on strategy selected are presented in Table 5. Note that the means for most items show a steady rise in value from summative, to mixed, to formative assessment.
Table 5.3 Mean Survey Item Scores as a Function of Strategy Used with Audience Response Systems
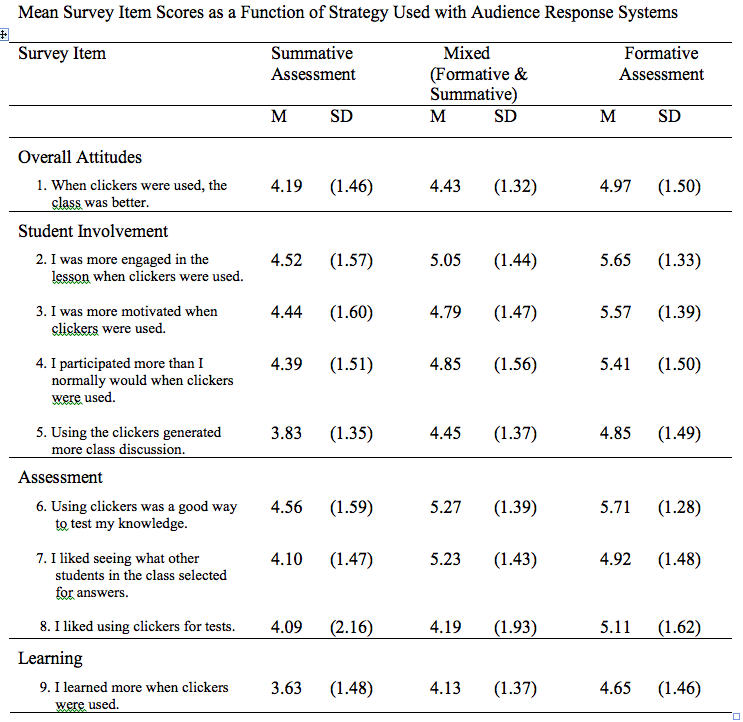
3 This table is a modified version of Table 7 from Kay, R. H. (in press). ↑
A MANOVA was run to compare these three approaches to using ARSs on the nine Likert scale questions assessing attitude toward ARSs (Table 6). Using ARSs for formative assessment was rated significantly more positively than summative assessment for all items on the ARSs attitude scale. In addition, a formative assessment approach showed significantly higher ratings than a mixed method (formative and summative) approach on most attitude scale items.
Table 6. MANOVA Examining Attitude toward Audience Response Systems as a Function of Teaching Strategy
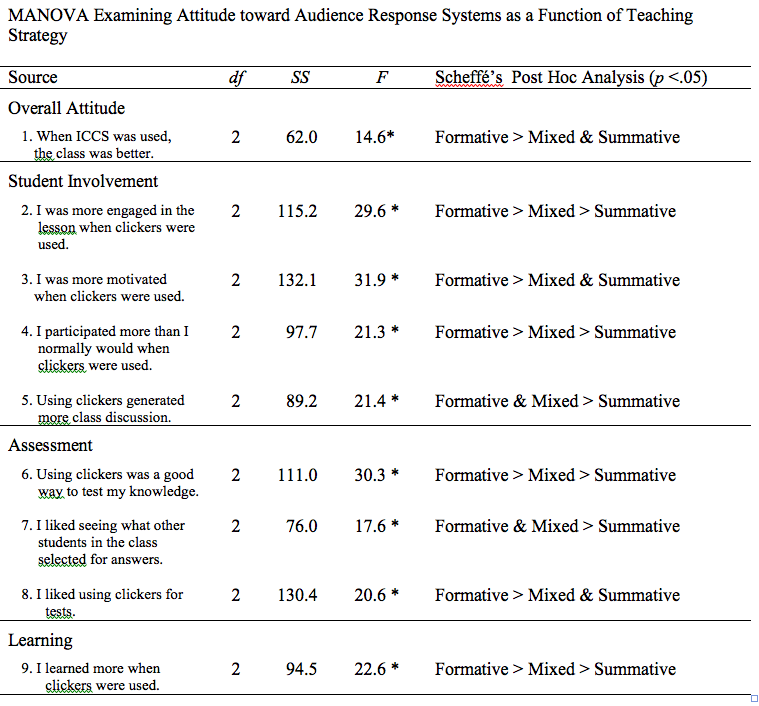
* p < .001
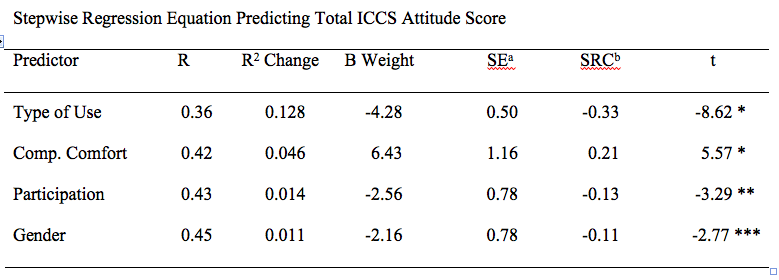
A stepwise multiple regression analysis was done to examine the relationship among the six individual difference factors examined in this paper (gender, grade level, subject area, computer comfort level, participation level, type of use ) and total attitude score on the ARS scale (Appendix A) The stepwise method was chosen because there was no previous theory to guide selection of predictors Four predictors were identified as being significant in the regression equation including type of use, computer comfort, participation and gender. Grade level and subject area were not significant predictors (see Table 7). Note that the total variance accounted for by the final regression equation was small at only 20%.
Multicollinearity did not appear to be a problem because no VIF (variance inflation factor) was over the acceptable level of 10 (Bowerman & O’Connell, 1990) and the average VIF (M=1.0) was not greater than one (Bowerman & O’Connell, 1990) when all variables were entered into the equation. The Durbin-Watson test produced a value of 1.52 indicating no problems with respect to autocorrelation of errors (Durbin & Watson, 1951).
Table 7. Stepwise Regression Equation Predicting Total ICCS Attitude Score
aSE - Standard Error
bSRC - Standard Regression Coefficient
* p < .001; * * p < .005; *** p < .01
The purpose of this study was to examine individual differences in attitudes toward ARSs. Six explanatory variables were chosen: gender, grade level, subject area, computer comfort level, participation level before the study, and type of use. The impact of each of these variables will be discussed.
Gender differences in computer attitudes over the past 25 years have been small but persistent in favour of males (AAUW, 2000; Barker & Aspray, 2006; Kay, 2008; Whitley, 1997). Differences in attitudes toward ARSs between males and females are consistent with previous research. Overall, males were significantly more positive than females toward ARSs, however, the effect size was moderate. In addition, males were significantly more positive on all but one item from the ARS attitude scale.
Because previous gender differences in computer attitudes is often associated with confidence and self-efficacy (AAUW, 2000; Barker & Aspray, 2006; Kay, 2008; Whitley, 1997), it is somewhat surprising that males were more positive than females about ARSs given that this technology has been reported by students to be easy to learn and use (e.g., Hinde & Hunt, 2006; Pelton & Pelton, 2006; Sharma, et al., 2005; Siau, et al., 2006). However, the regression analysis done with all six variables indicated type of use, computer comfort, and previous participation levels may be more important than gender in terms of influencing attitude toward ARSs. It is important to gather more qualitative evidence, perhaps in the form of interviews or focus groups, to identify why females may be more uncomfortable with ARSs.
Research on the impact of age or grade level on attitudes toward computers and ARSs has presented a mixed picture. On the one hand, younger students have been observed to be more enthusiastic about computers (e.g., Colley, 2003; Colley & Comber, 2003). On the other hand, Preszler et al. (2007) suggest that older students might be more resistant to ARSs because they are accustomed to other methods of teaching. Results from the current study, indicate that grade had no impact on attitudes towards ARSs in a secondary school environment. It is possible that secondary school students are more accepting of new technology, regardless of age. Moreover, they may have had less time than higher education students to settle into preferred learning patterns or teaching styles.
Little research has been done to date examining attitude toward ARSs among different subject areas. In this study, secondary students in social sciences classes were consistently more positive about ARSs than either mathematics or science students. However, the regression analysis comparing all six variables indicated that subject area was not significant predictor of attitude toward ARSs. It is possible that type of use was an overriding factor. A quick look at the data reveals that in social science courses, summative assessment was used only 17% of the time, whereas in mathematics and science courses it was used over 35% of the time. Therefore, the main reason that social science students have more positive attitude toward ARSs might reflect how ARSs were used rather than the subject area taught. More systematic research is needed to determine if certain subject areas are more naturally disposed to the use of multiple choice questions for guiding instruction.
Secondary students who were more comfortable with computers were more positive about ARSs on eight of the nine scale items in Appendix A. This result is consistent with previous research on computer comfort level and computer related behaviour (e.g., Barbeite & Weiss, 2004; Durndell & Haag, 2002; Shapka & Ferrari, 2003; Solvberg, 2002), although somewhat unexpected given that ARSs are easy to use and learn. It is important to note, though, that only 13% of the total sample was uncomfortable with computers, so negative attitudes are not the norm. More research is needed in the secondary school environment to explore why differences exist so that educators can help accommodate less technologically savvy students who may be disadvantaged when using ARSs.
Students who normally participate less in a traditional secondary school classroom environments appear to benefit more from ARSs in certain keys areas. They participate more in class, they like using ARSs more for tests, and they feel that they learn more than students who participate more than they do in a traditional class. This result makes some sense because responding to ARS questions is easy and anonymous. Students, who are normally reluctant to participate for fear of being embarrassed by an incorrect answer in front of the class, do not have to worry about exposure when an ARS was used. Furthermore, increased participation using the remote devices may have convinced “low participation” students that they were learning more. The impact of previous participation level, while somewhat narrow, was strong enough to be included in the final regression equation as a significant predictor of attitude toward ARSs.
While pedagogy is considered critical when using ARSs (Reay et al., 2005; Simpson & Oliver, 2007; Stuart et al., 2004), limited research has been done comparing different teaching strategies. The data in this study suggest that students prefer formative assessment over summative assessment when using ARSs. In addition, type of use appears to be one of the principle predictors of attitudes when all variables are entered into a regression equation. Simply using an ARS does not guarantee positive attitudes - the type of strategy employed influences secondary school students’ overall perception of effectiveness. While it may seem like a time saving approach in terms of grading to use ARSs for formal tests, many secondary school students appear not to like this practice.
The regression analysis indicated that type of use, computer comfort, previous participation level, and gender were significant predictors of attitudes toward ARSs, whereas grade level and subject area were not. This result is consistent with the individual analyses of each variable. It is difficult, though, to accurately estimate the relative importance of the predictor variables. It is noteworthy that all four predictors accounted for only 20% of the total variance in attitudes toward ARS. More research is needed to identify other factors that might influence the acceptance of ARSs.
This study was a first attempt to investigate individual differences in attitudes toward ARSs in secondary school classrooms. Analysis of the data was based on a comprehensive review of the literature examining the use of ARSs in higher education. There are a number of caveats, though, that need to be considered when interpreting the results.
First, the results are based on one data collection source– survey questions. While the survey was judged to be reliable, triangulation of data collection tools is recommended for future studies. Specifically, qualitative data is needed to understand some key questions. For example it is unclear why gender differences and computer comfort level influence student attitudes when using an ARS is so easy to learn and use.
Second, the results are based on limited use of ARSs – one or two times in a month. The impact on attitudes could be decidedly different when ARSs are used on a regular basis. For example, long term use might attenuate the impact of gender and computer comfort level once students became used to using ARSs.
Third, a wider variety of teaching strategies used with ARSs should be examined in order to acquire a more complete picture of effectiveness and individual differences. One promising strategy that has yet to be examined in secondary school, but which has received considerable acclaim in higher education, is peer-based teaching. Peer-based instruction involves displaying a higher-level question that could identify a misconception, asking students to click in an answer, giving students time to discuss and defend their answers with two to four peers, taking a re-vote on the original question, and having the instructor provide a brief summary. A number of researchers have reported considerable success with this approach (Draper & Brown, 2004; Hinde & Hunt, 2006; Pelton & Pelton, 2006; Webking & Valenzuela, 2006).
Fourth, a more detailed, survey of ARSs attitudes needs to be developed where the construct validity of specific factors such student involvement, assessment and learning is tested. The measure of total attitude used in this study was considered reliable, but the validity of individual items assessed was not established.
Finally, a good next step in researching individual differences associated with the use of ARSs is to look at actual learning behaviour and performance. While there may be an implicit assumption that individual differences in attitudes affect overall learning experience, this assumption has yet to be tested. It is not clear whether individual differences in attitudes based on type of use, computer comfort level, previous participations rates, and gender translate to changes in actual learning.
The purpose of this study was to investigate individual differences in attitudes toward ARSs in secondary school classrooms. Six explanatory variables were looked at including gender, grade level, subject area, computer comfort, previous participation levels, and type of use. The results indicated that males, students with a high computer comfort level, and students who do not actively participate in class had significantly higher positive attitude toward ARSs. It was also observed that students were significantly more positive about using ARSs when it was used for formative as opposed to summative assessment. There were no significant differences observed for grade level or subject area taught.
Abrahamson, L. (2006). A brief history of networked classrooms: Effects, cases, pedagogy, and implications. In D. A. Banks (Ed.), Audience Response Systems in Higher Education (pp. 1-25). Hershey, PA: Information Science Publishing.
American Association of University Women (2000). Tech-Savvy: Educating girls in the new computer age. Washington, DC: American Association of University Women Foundation. Retrieved December 1, 2006 fromhttp://www.aauw.org/member_center/publications/TechSavvy/TechSavvy.pdf
Barbeite, F. G., & Weiss, E. M. (2004). Computer self-efficacy and anxiety scales for an Internet sample: Testing measurement equivalence of existing measures and development of new scales. Computers in Human Behavior, 20(1), 1-15.3444
Barker, L. J., & Aspray, W. (2006). The state of research on girls and IT. In J. M. Cohoon & W. Aspray (Eds.), Women and information technology (pp. 3-54).Cambridge, MA: The MIT Press.
Beatty, I. (2004). Transforming Student Learning with Classroom Communication Systems. EDUCAUSE Research Bulletin, (3), 1-13. Retrieved November 3, 2007 http://www.educause.edu/ir/library/pdf/ERB0403.pdf
Bergtrom, G. (2006). Clicker sets as learning objects. Interdisciplinary Journal of Knowledge and Learning Objects, 2. Retrieved November 3, 2007 from http://ijklo.org/Volume2/v2p105-110Bergtrom.pdf
Bowerman, B. L., & O’Connell, R. T. (1990). Linear statistical models: An applied approach (2nd ed.). Belmont, CA: Druxbury.
Brewer, C. A. (2004). Near real-time assessment of student learning and understanding in biology courses, BioScience, 54(11), 1034-1039.
Burnstein, R. A., & Lederman, L. M. (2001). Using wireless keypads in lecture classes. The Physics Teacher, 39(1), 8-11.
Caldwell, J. E. (2007). Clickers in the large classroom: Current research and best-practice tips. Life Sciences Education, 6(1), 9-20.
Carnaghan, C., & Webb, Alan. (2007). Investigating the effects of group response systems on student satisfaction, learning, and engagement in accounting education. Issues in Accounting Education, 22(3), 391-409.
Cohen, J. (1988). Statistical power analysis for the behavioral sciences (2nd ed.). Hillsdale, NJ: Lawrence Erlbaum Associates.
Colley, A. (2003). Gender differences in adolescents’ perceptions of the best and worst aspects of computing at school. Computers in Human Behaviour, 19, 673-682.
Colley, A., & Comber, C. (2003). Age and gender differences in computer use and attitudes among secondary school students: what has changed? Educational Research, 45(2), 155-165.
Cuban, L. (2001). Oversold and underused: Computers in the classroom. Cambridge, MA: Harvard University Press.
Draper, S. W., & Brown, M. I. (2004). Increasing interactivity in lectures using an electronic voting system. Journal of Computer Assisted Learning, 20(2), 81-94.
Dufresne, R. J., & Gerace, W. J. (2004). Assessing-to-learn: formative assessment in physics instruction. The Physics Teacher, 42, 428-433.
Durbin, J., & Watson, G. S. (1951). Testing for serial correlation in least squares regression, II. Biometrika, 30, 159-178.
Durndell, A., & Haag, Z. (2002). Computer self efficacy, computer anxiety, attitude towards the internet and reported experience with the internet, by gender, in an east European sample. Computers in Human Behaviour, 18(5), 521-535.
El-Rady, J. (2006). To click or not to click: That's the question. Innovate Journal of Online Education, 2(4). Retrieved November 3, 2007 from http://www.innovateonline.info/index.php?view=article&id=171
Fies, C., & Marshall, J. (2006). Classroom response systems: A review of the literature. Journal of Science Education and Technology, 15(1), 101-109.
Greer, L., & Heaney, P. J. (2004. Real-time analysis of student comprehension: an assessment of electronic student response technology in an introductory earth science course. Journal of Geoscience Education, 52(4), 345-351.
Hatch, J., Jensen, M., & Moore, R. (2005). Manna from heaven or clickers from hell. Journal of College Science Teaching, 34(7), 36-39.
Hinde, K., & Hunt, A. (2006). Using the personal response system to enhance student learning: Some evidence from teaching economics. In D. A. Banks (Ed.),Audience Response Systems in Higher Education (pp. 140-154). Hershey, PA: Information Science Publishing.
Judson, E., & Sawada, D. (2002). Learning from past and present: Electronic response systems in college lecture halls. Journal of Computers in Mathematics and Science Teaching, 21(2), 167-181.
Kay, R. H. (in press). A formative analysis of interactive classroom communication systems used in secondary school classrooms. Handbook of Research on New Media Literacy at the K-12 Level.
Kay, R. H. (2008). Exploring gender differences in computer-related behaviour: Past, present, and future. In T .T. Kidd & I. Chen, Social Information Technology: Connecting Society and Cultural Issues (pp. 12-30). Hershey, PA: Information Science Reference.
Kirk, R. E. (1982) Experimental Design (2nd ed.). Monterey, CA: Brooks/Cole Publishing Company.
Latessa, R., & Mouw, D. (2005). Use of audience response systems to augment interactive learning. Family Medicine, 37(1), 12 -14. Retrieved November 3, 2007 from http://www.stfm.org/fmhub/fm2005/January/Robyn12.pdf
Nicol, D. J., & Boyle, J. T. (2003). Peer instruction versus class-wide discussion in large classes: a comparison of two interaction methods in the wired classroom. Studies in Higher Education, 28(4), 457-473.
Pelton, L. F., v Pelton, T. (2006). Selected and constructed response systems in mathematics. In D. A. Banks (Ed.), Audience Response Systems in Higher Education (pp. 175-186). Hershey, PA: Information Science Publishing.
Preszler, R.W., Dawe, A., Shuster, C.B., & Shuster, M. (2007). Assessment of the effects of student response systems on student learning and attitudes over a broad range of biology courses. CBE-Life Sciences Education, 6(1), 29-41.
Reay, N. W., Bao, L., Li, P., Warnakulasooriya, R., & Baugh, G. (2005). Toward the effective use of voting machines in physics lectures. American Journal of Physics, 73(6), 554-558.
Russell, M., Bebell, D., O’Dwyer, L., & O’Connor, K. (2003). Examining teacher technology use: Implications for preservice and inservice teacher preparation. Journal of Teacher Education, 54(4), 297-310.
Shapka, J. D. & Ferrari, M. (2003). Computer-related attitudes and actions of teacher candidates. Computers in Human Behaviour, 19(3), 319-334.
Sharma, M. D., Khachan, J., Chan, B., & O'Byrne, J. (2005). An investigation of the effectiveness of electronic classroom communication systems in large lectures. Australasian Journal of Educational Technology, 21(2), 137-154.
Siau, K., Sheng, H. & Nah, F. (2006). Use of classroom response system to enhance classroom interactivity, IEEE Transactions on Education, 49(3), 398-403.
Simpson, V., & Oliver, M. (2007). Electronic voting systems for lectures then and now: A comparison of research and practice. Australasian Journal of Educational Technology,23(2), 187-208.
Slain, D., Abate, M., Hidges, B. M., Stamatakis, M. K., & Wolak, S. (2004).An interactive response system to promote active learning in the doctor of pharmacy curriculum. American Journal of Pharmaceutical Education, 68(5), 1-9.
Solvberg, A. (2002). Gender differences in computer-related control beliefs and home computer use. Scandinavian Journal of Educational Research, 46(4), 410-426.
Stuart, S. A. J., Brown, M. I., & Draper, S.W. (2004). Using an electronic voting system in logic lectures: one practitioner’s application. Journal of Computer Assisted Learning, 20(2), 95-102
Trees, A. R., & Jackson, M. H. (2007). The learning environment in clicker classrooms: student processes of learning and involvement in large university-level course using student response systems. Learning, Media, and Technology, 32(1), 21-40.
Uhari, M., Renko, M., & Soini, H. (2003). Experiences of using an interactive audience response system in lectures. BMC Medical Education, 3(12), 1-6.
Van Dijk, L. A., Van Den Berg, G. C., & Van Keulen, H. (2001). Interactive lectures in engineering education. European Journal of Engineering Education, 26(1), 15-28.
Webking, R., & Valenzuela, F. (2006). Using audience response systems to develop critical thinking skills. In D. A. Banks (Ed.), Audience Response Systems in Higher Education (pp. 127-139). Hershey, PA: Information Science Publishing.
Whitley, B. E., Jr. (1997). Gender differences in computer-related attitudes and behaviors: A meta-analysis. Computers in Human Behavior, 13, 1-22.
A. What grade are you in?
B. Gender (circle one) Male Female
C. How comfortable are you with technology? (circle one)
Not at all comfortable Somewhat Comfortable Comfortable Very Comfortable
E. How often did you use ICCS in the past month?
Never 1-2 times Once a week 2-3 times per week